Monitor Data Quality

The Monitor Data Quality is a data governance feature that monitors the quality of the data in the catalog. This feature helps define the products better and takes corrective actions to maintain a good quality of data.

Key Term:
  • Data Governance: is an approach to managing a company’s data assets. It defines who is accountable for various aspects of an organization’s data as well as including procedures which define how the data is used, structured and stored. This includes data quality rules and KPIs through the Dashboard.
Description:
  • All set rules regarding Accuracy, Completeness, Conformity, and Uniqueness are monitored using this feature.
  • The Dashboard and Graphical View display the results as per data in the system.
  • The results show a combination of all the Data Quality measures: Accuracy, Completeness, Conformity and Uniqueness. These measures are displayed in percentage format.
  • The users/suppliers can have a detailed view of all the products in a report that explores the quality issues.
Related topics:
Application:
  • Dashboards often provide at-a-glance views of KPIs (Key Performance Indicators) relevant to a particular objective or business process.

  • These reports help a user understand the products in the system and if there are any errors in them. Also, a user is presented with a precise and accurate view of the data in the system with respect to Data Quality.

  • A user can see all the set rules together in a single graph.

  • Example:

    Supplier A has about 1000 products in the system and few of them have incomplete data. The supplier will be able to track the same with the help of graphs on the Dashboard so the supplier can properly take corrective actions.

How-to: Monitor Data Quality

To monitor data quality, follow these steps:


  • Log in and go to Administration.
../../../../../_images/pxp_monitordataquality_login.PNG


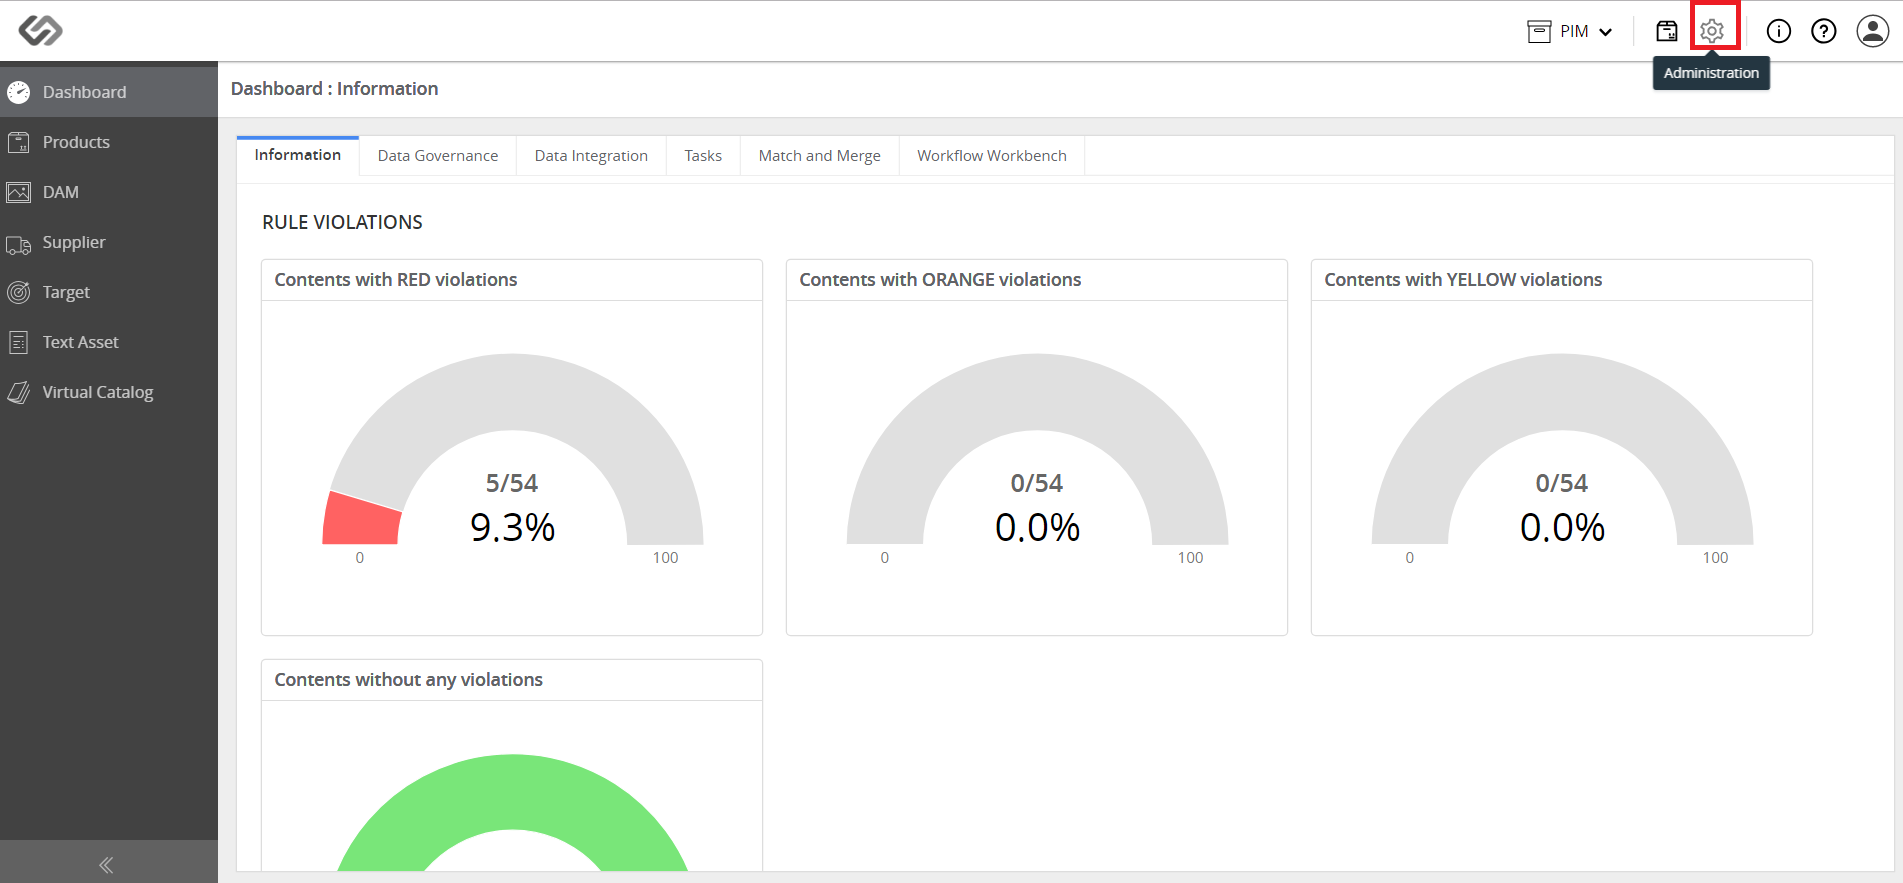
  • Click on Data Governance.
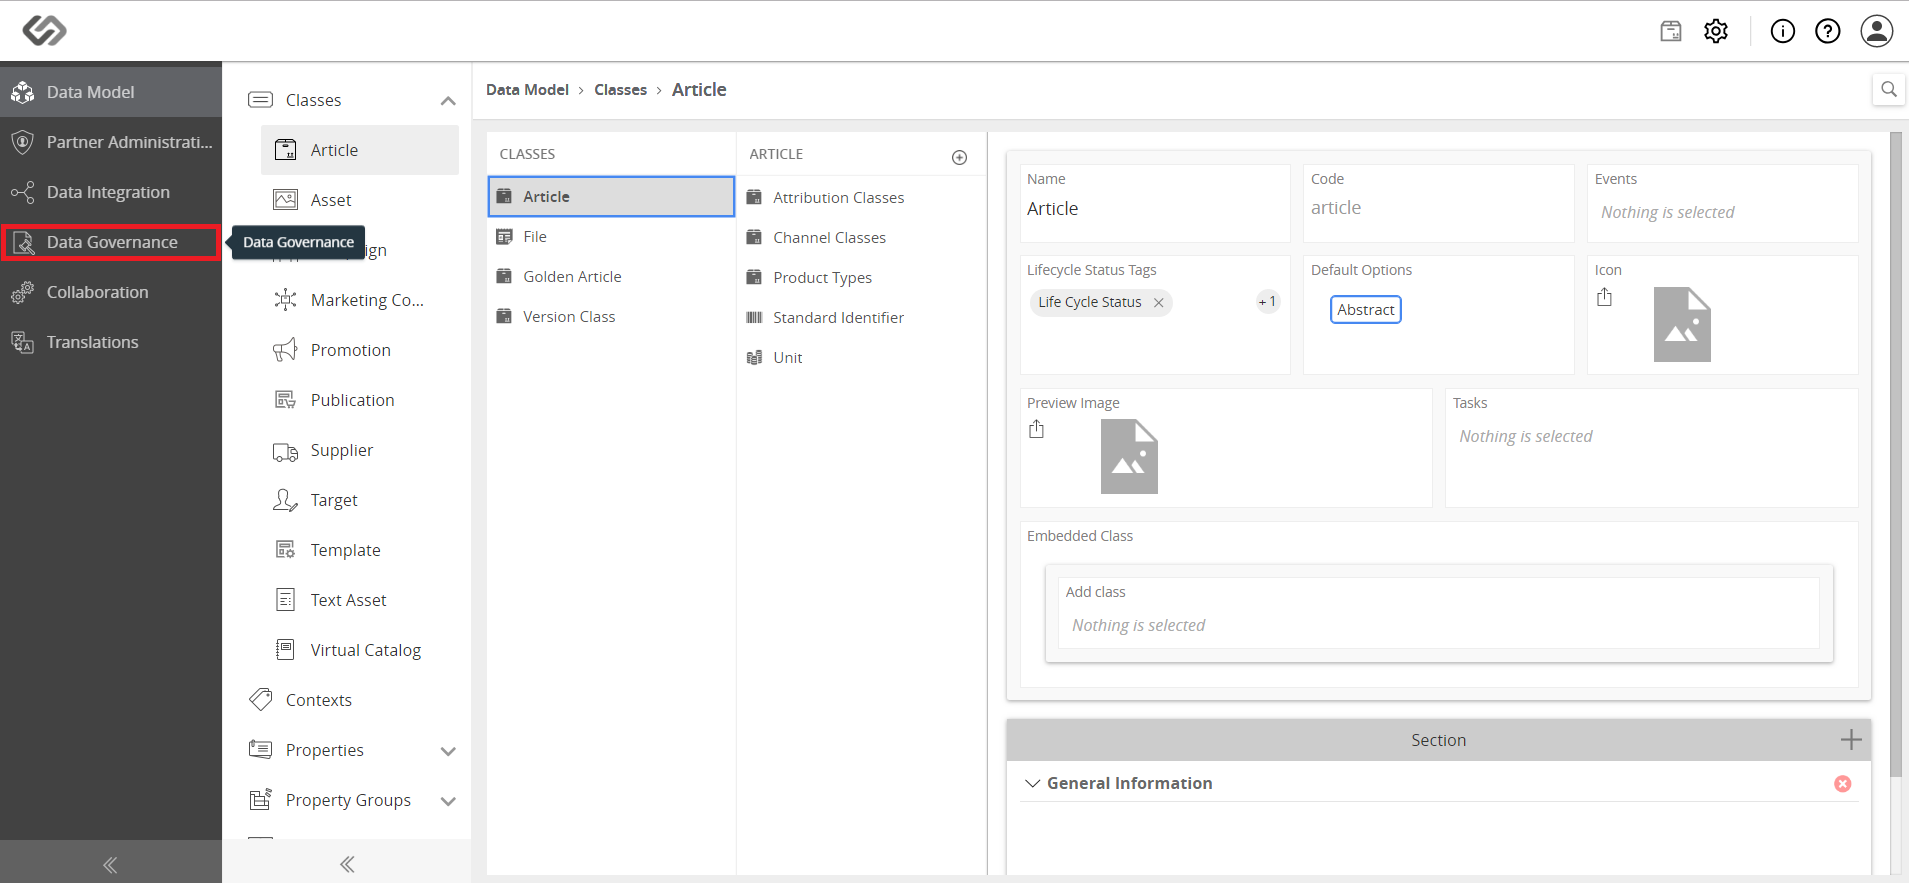
../../../../../_images/pxp_monitordataquality_clickondatagovernance.PNG


  • Click on KPIs.
../../../../../_images/pxp_monitordataquality_clickonkpis.PNG


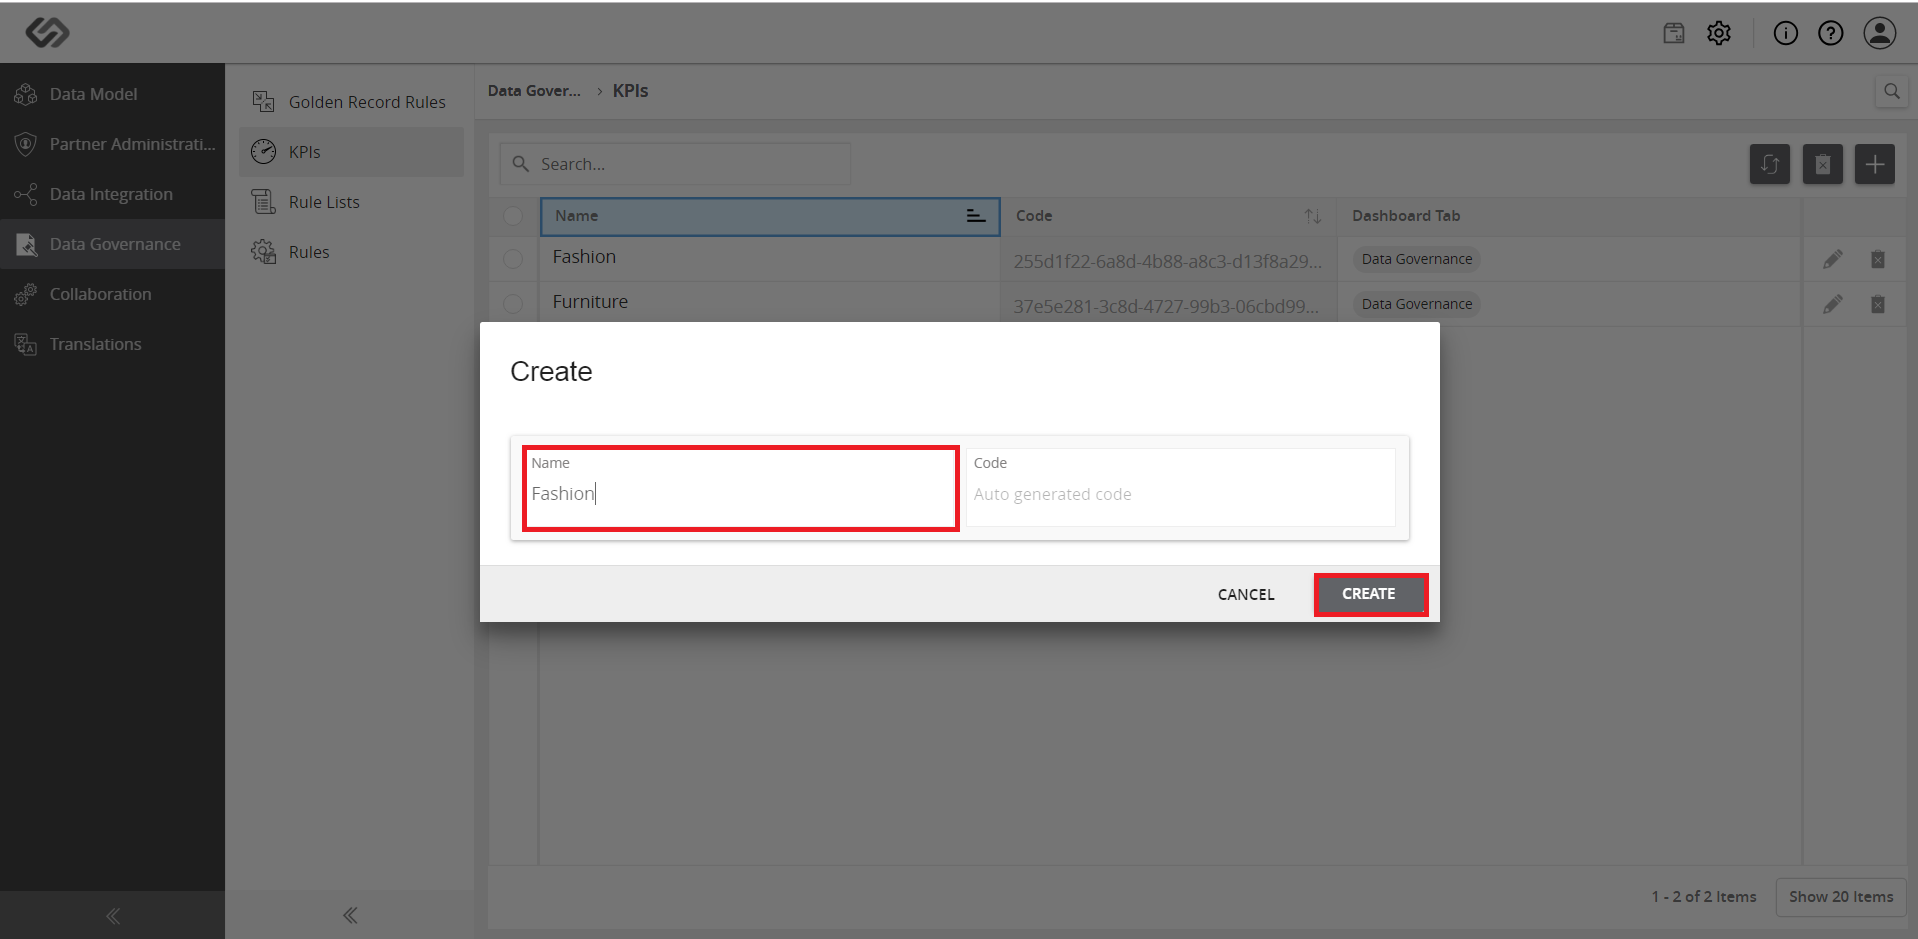
  • Click on the ‘+’ icon to create a new KPI.
../../../../../_images/pxp_monitordataquality_clickontheicontocreatenewkpi.PNG


  • Fill out the name and click on the Create button.
../../../../../_images/pxp_monitordataquality_filloutthename.PNG


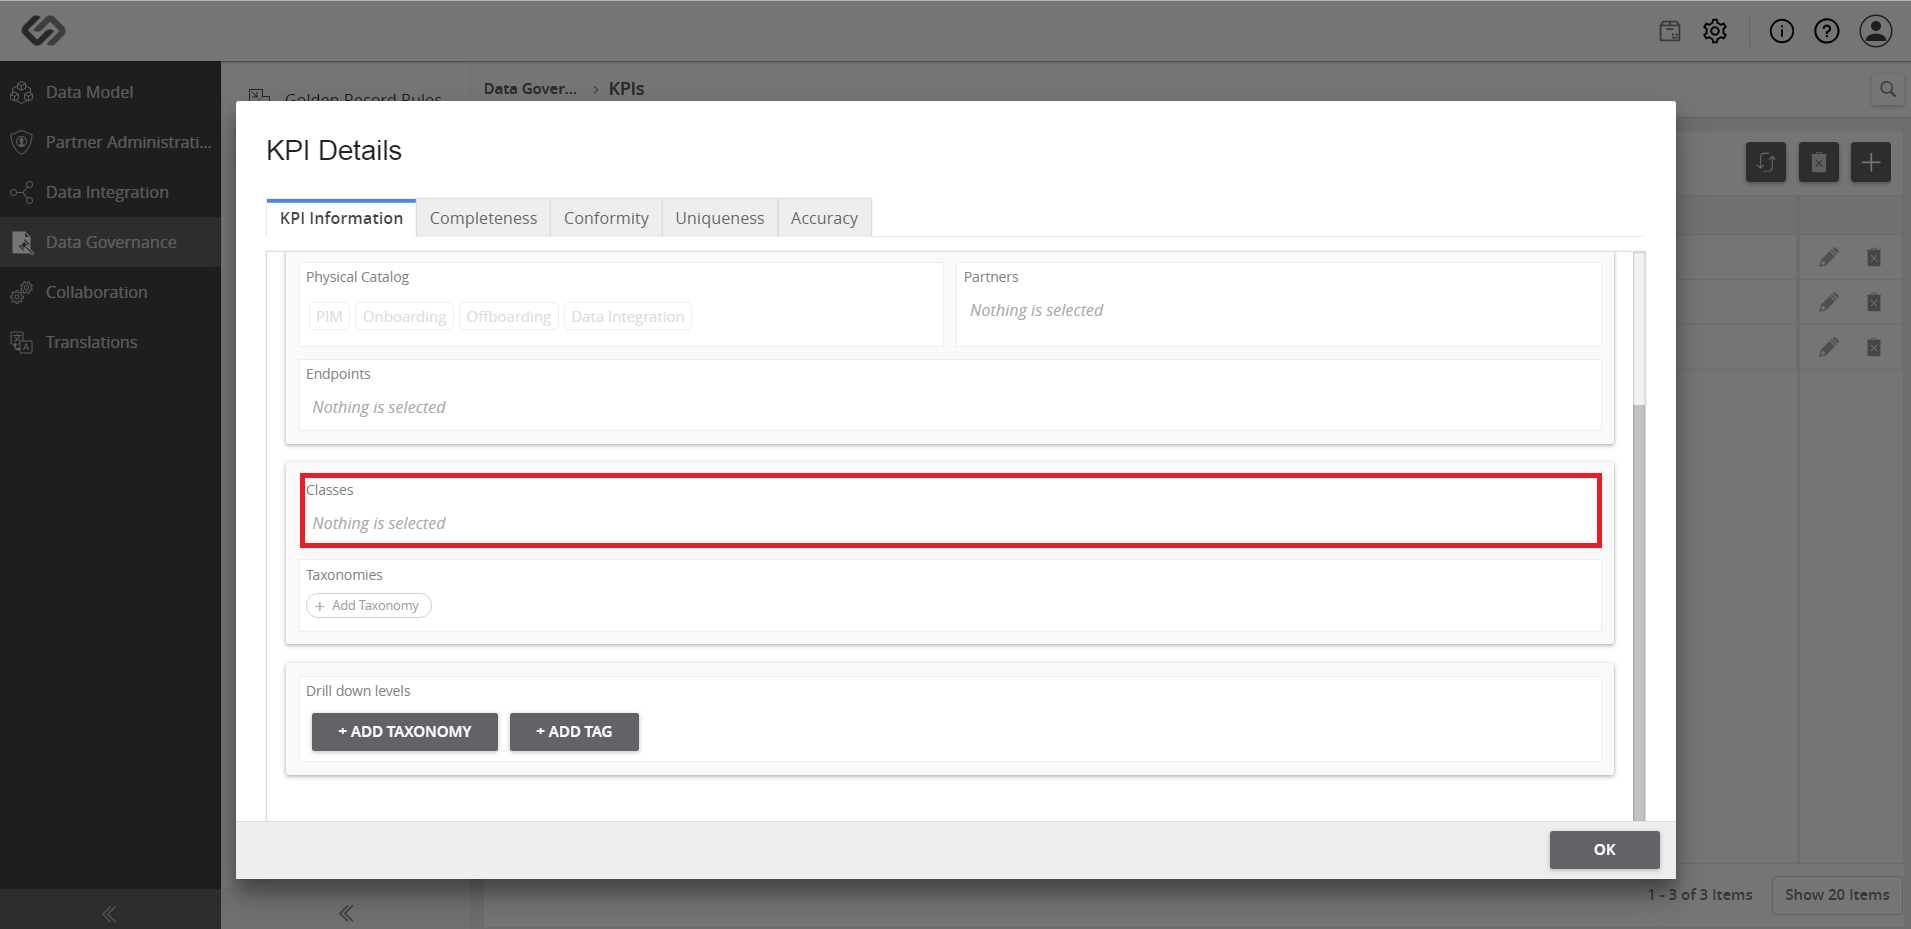
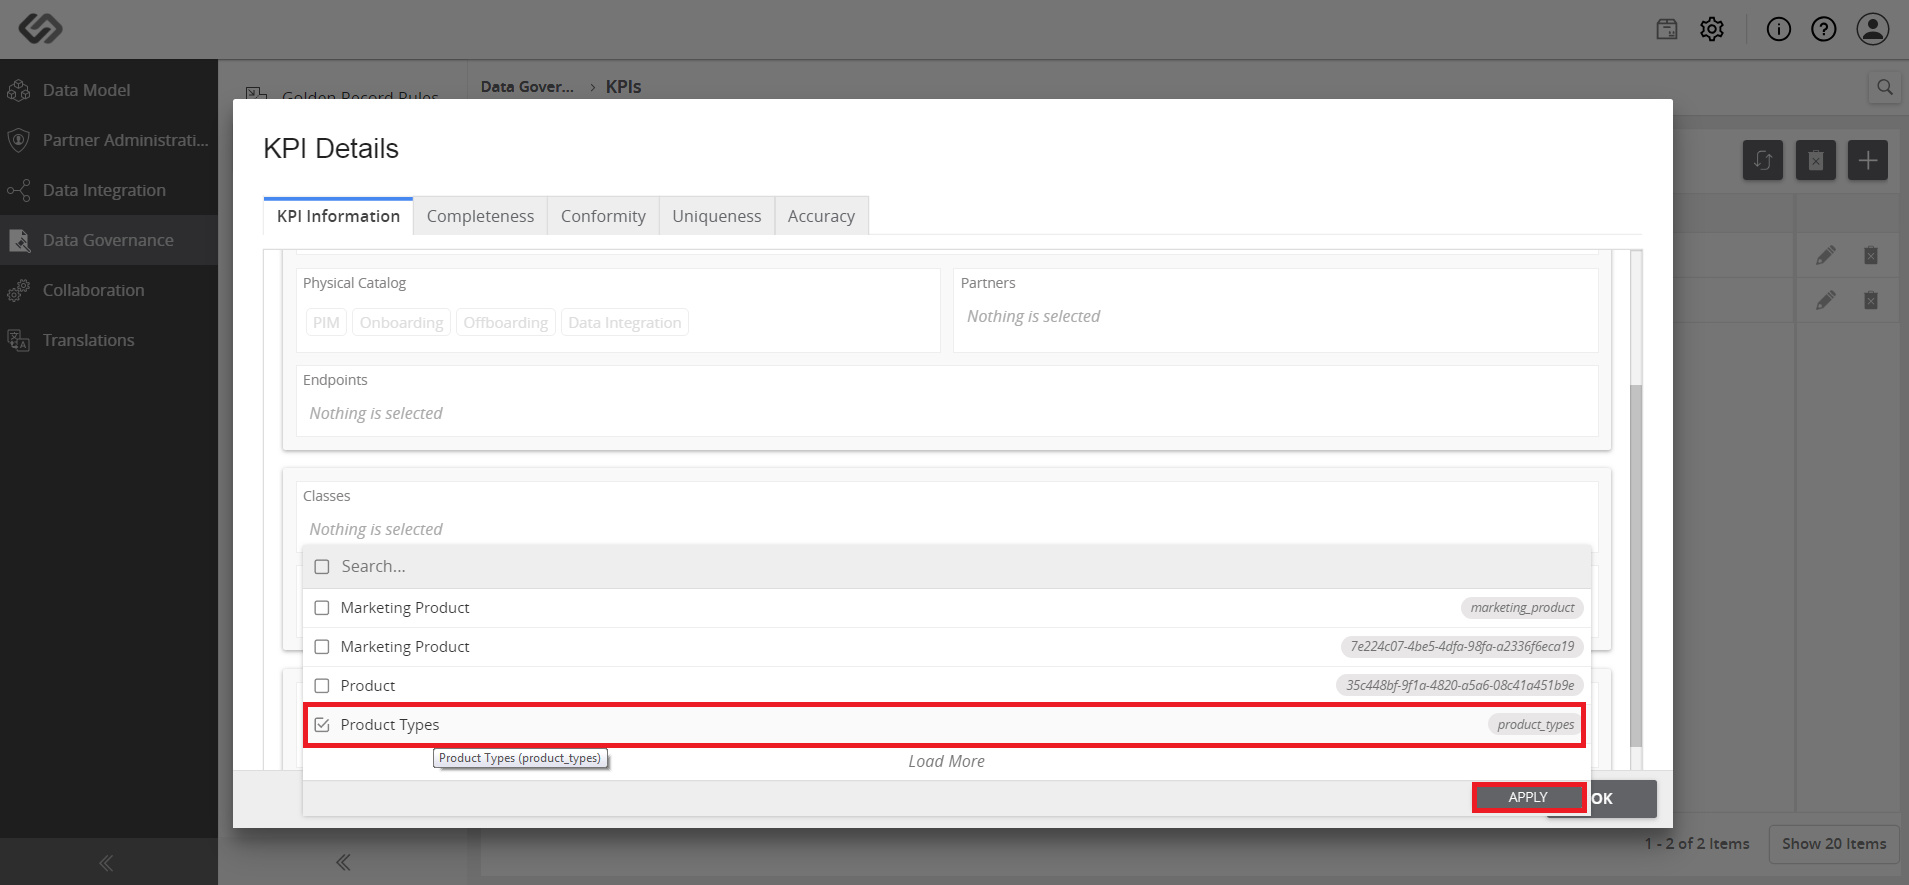
  • On the KPI Details page, select a Class and Taxonomy, which will use the KPI. Click the Apply button.
../../../../../_images/pxp_monitordataquality_selectclassandtaxonomy.PNG

../../../../../_images/pxp_monitordataquality_selectclassandtaxonomy2.PNG


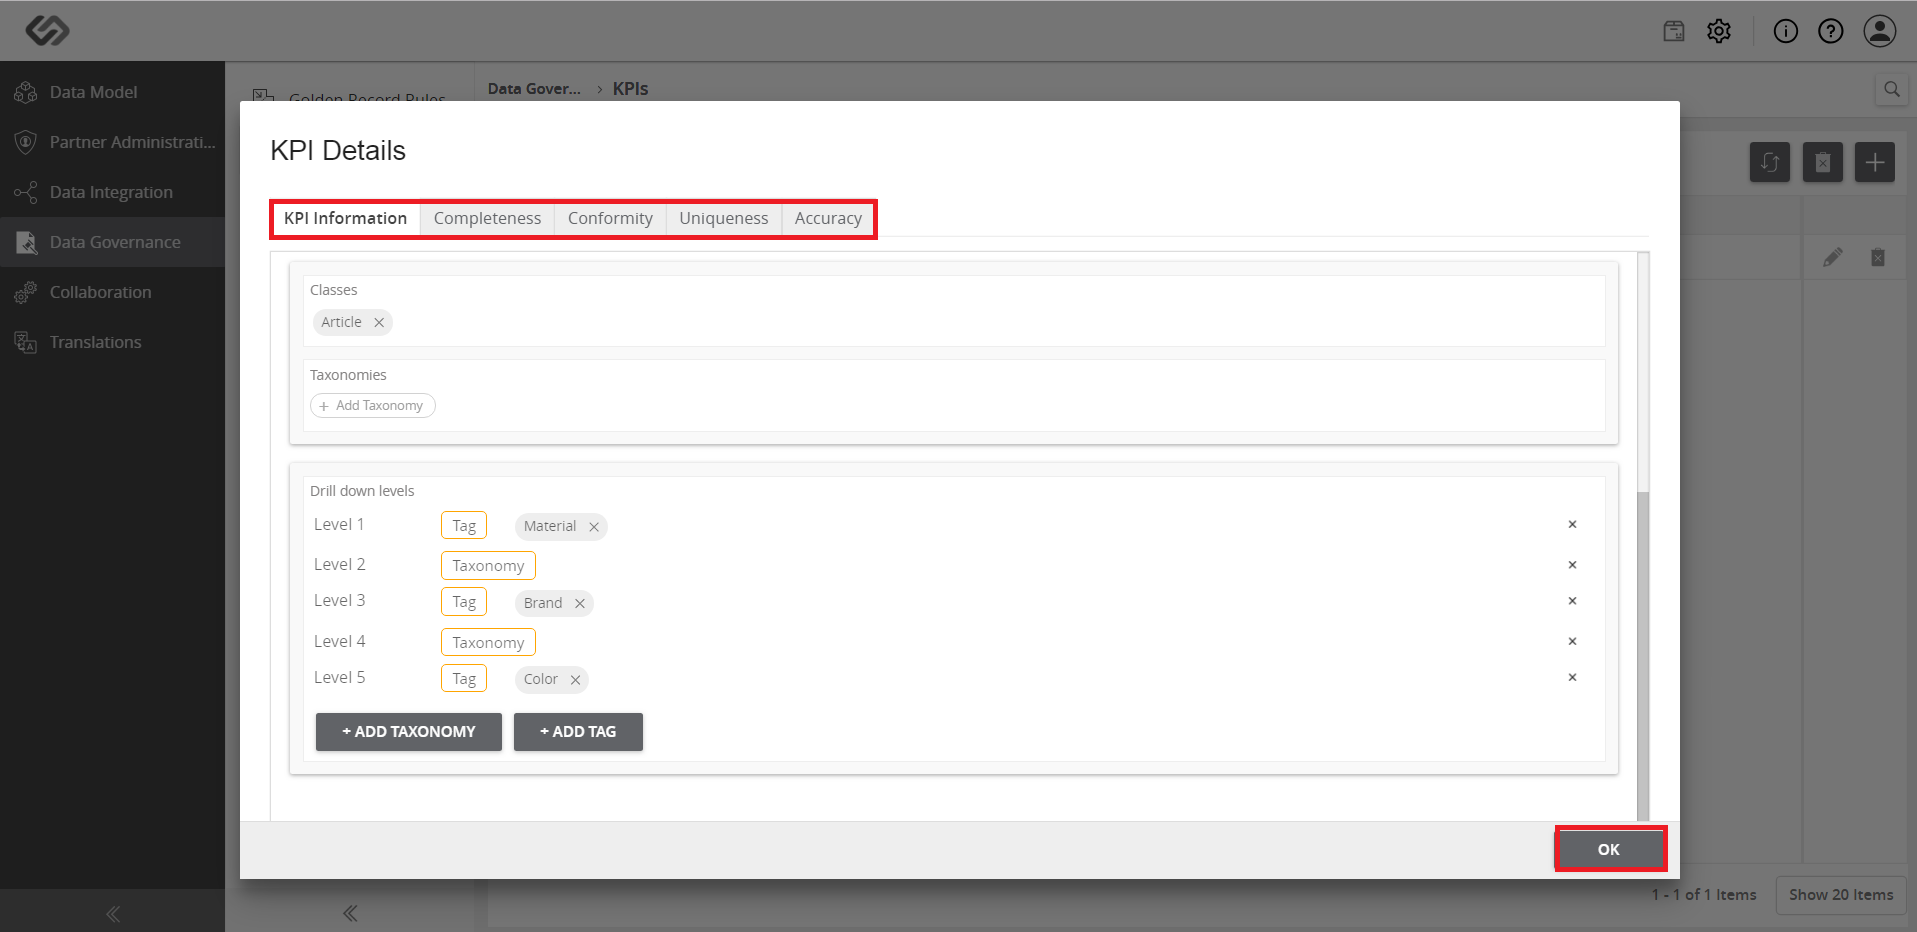
  • For the Drill down levels, add Tags or Taxonomies, where the KPI is to be categorized into.
../../../../../_images/pxp_monitordataquality_forthedrilldownlevels.PNG


  • Provide the details of the rules and once done, click on the OK button.
../../../../../_images/pxp_monitordataquality_filloutthedetailsoftherules.PNG


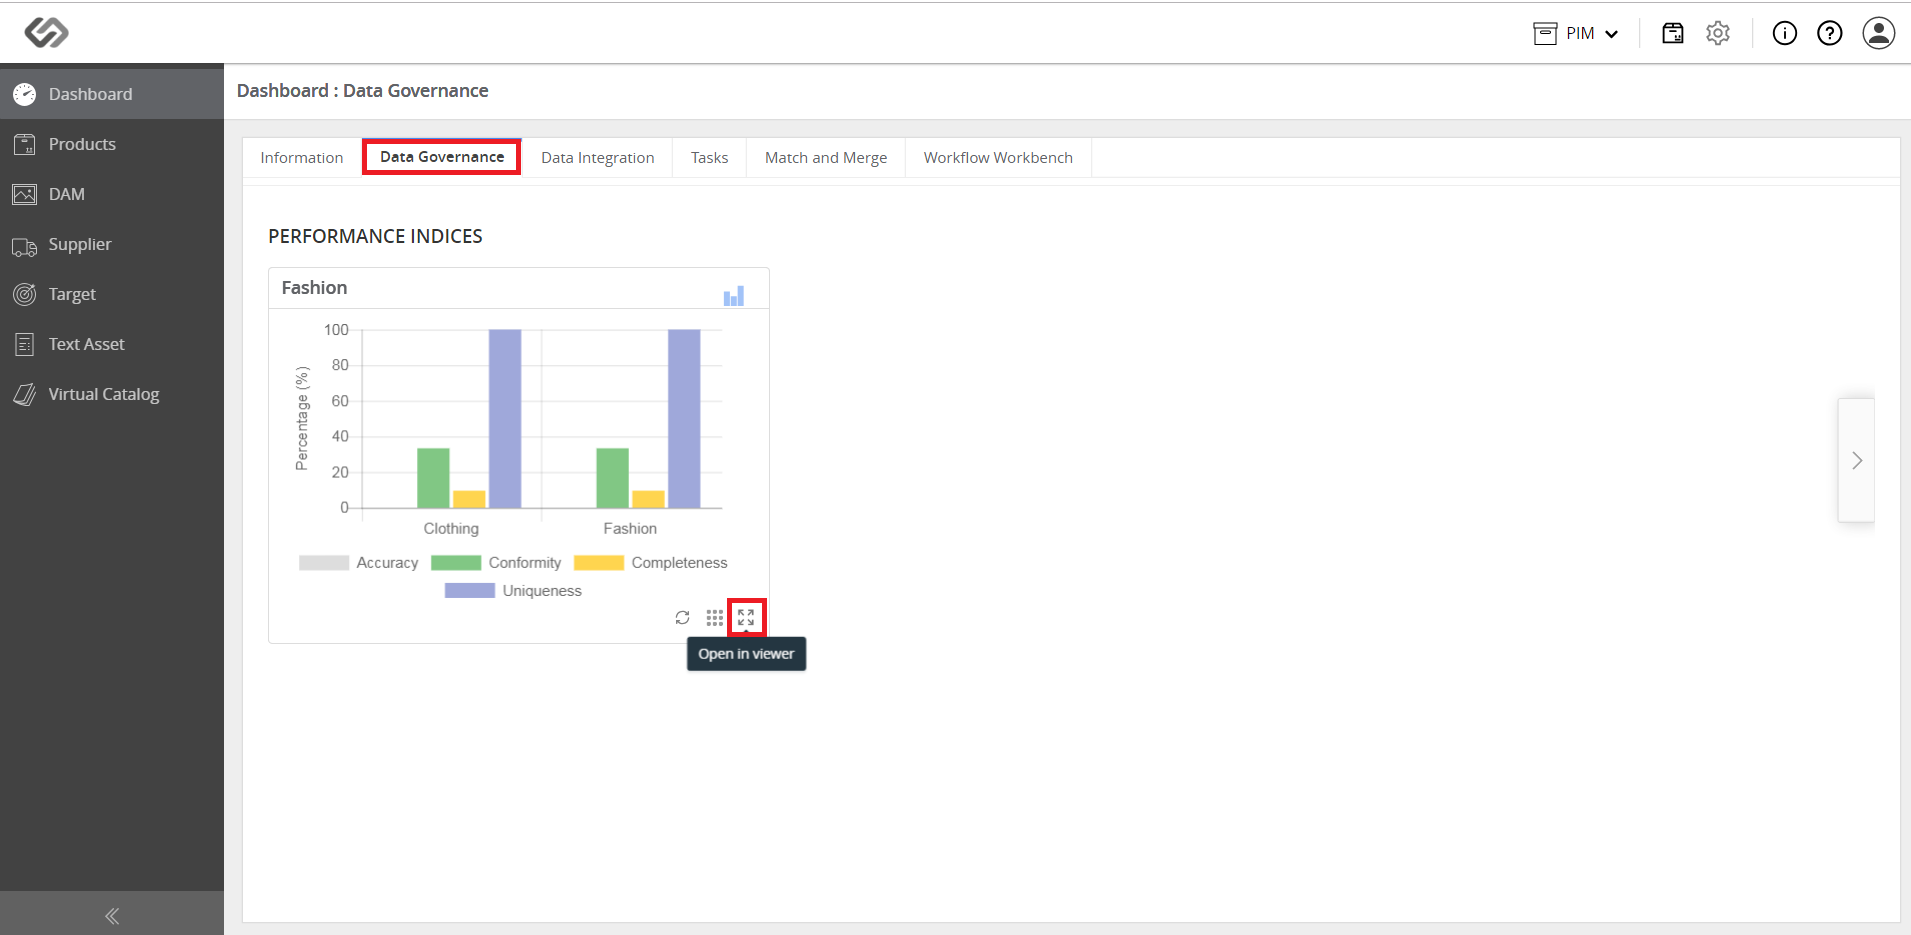
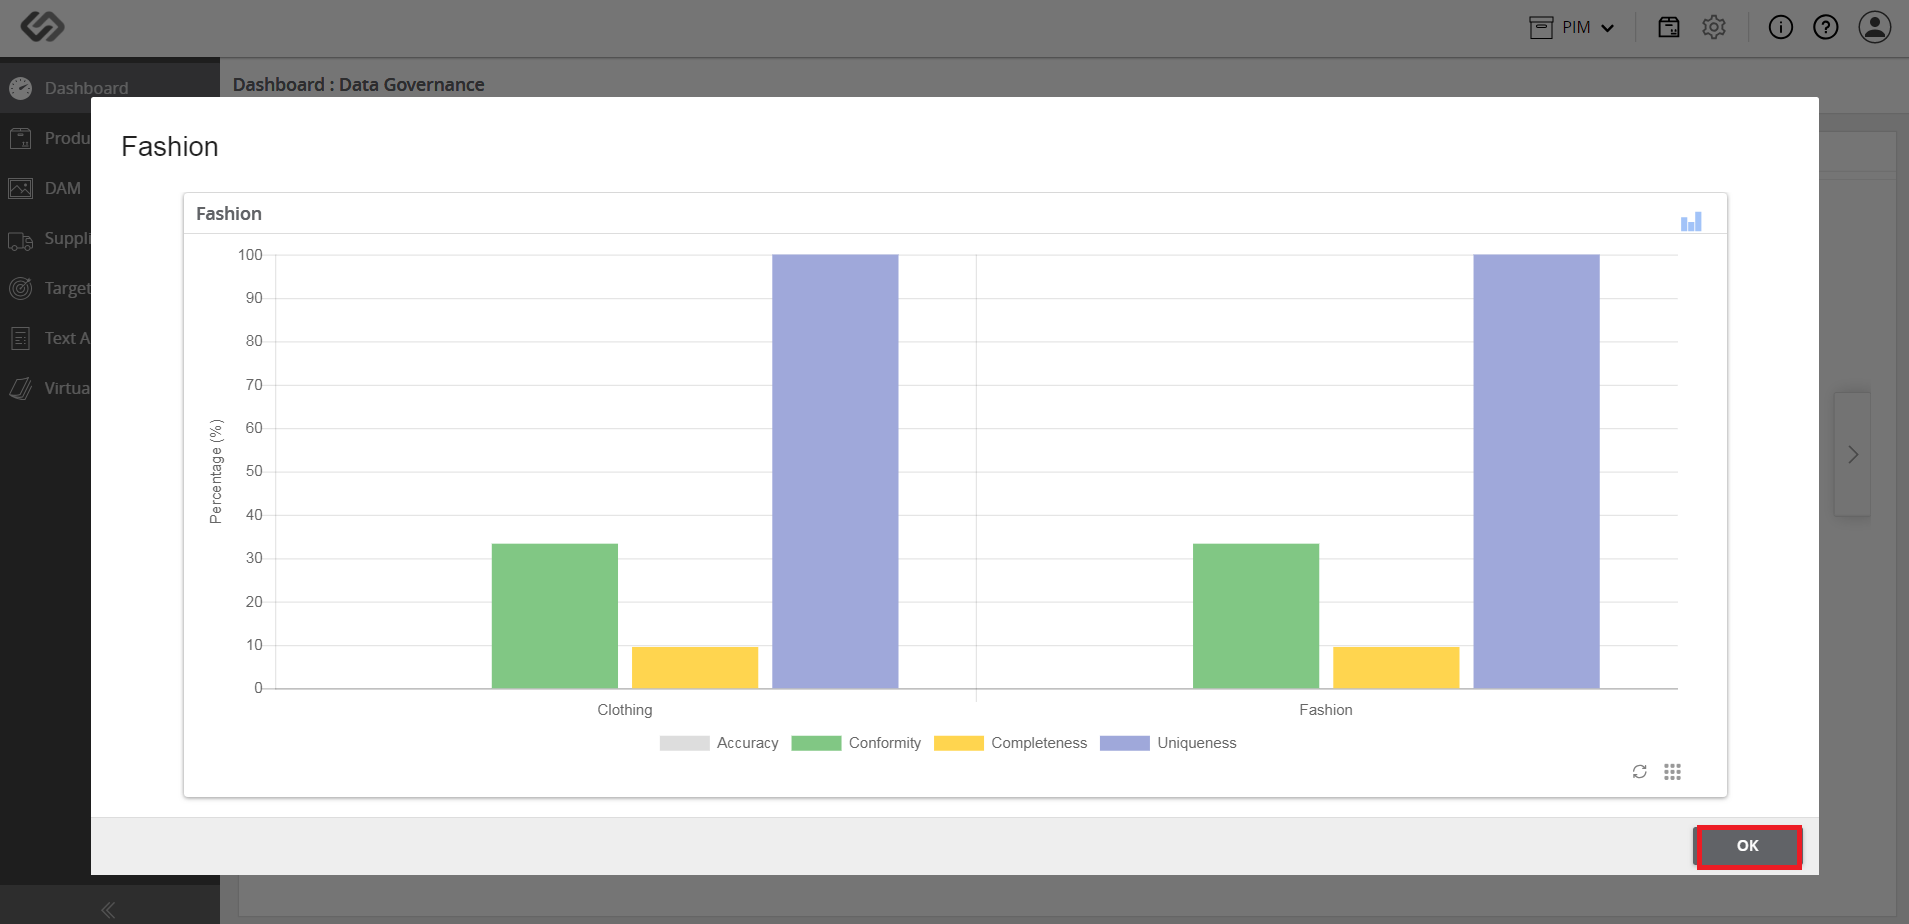
  • Click on the Explore icon and then go to Dashboard.
../../../../../_images/pxp_monitordataquality_clickonexploreandthendashboard.PNG


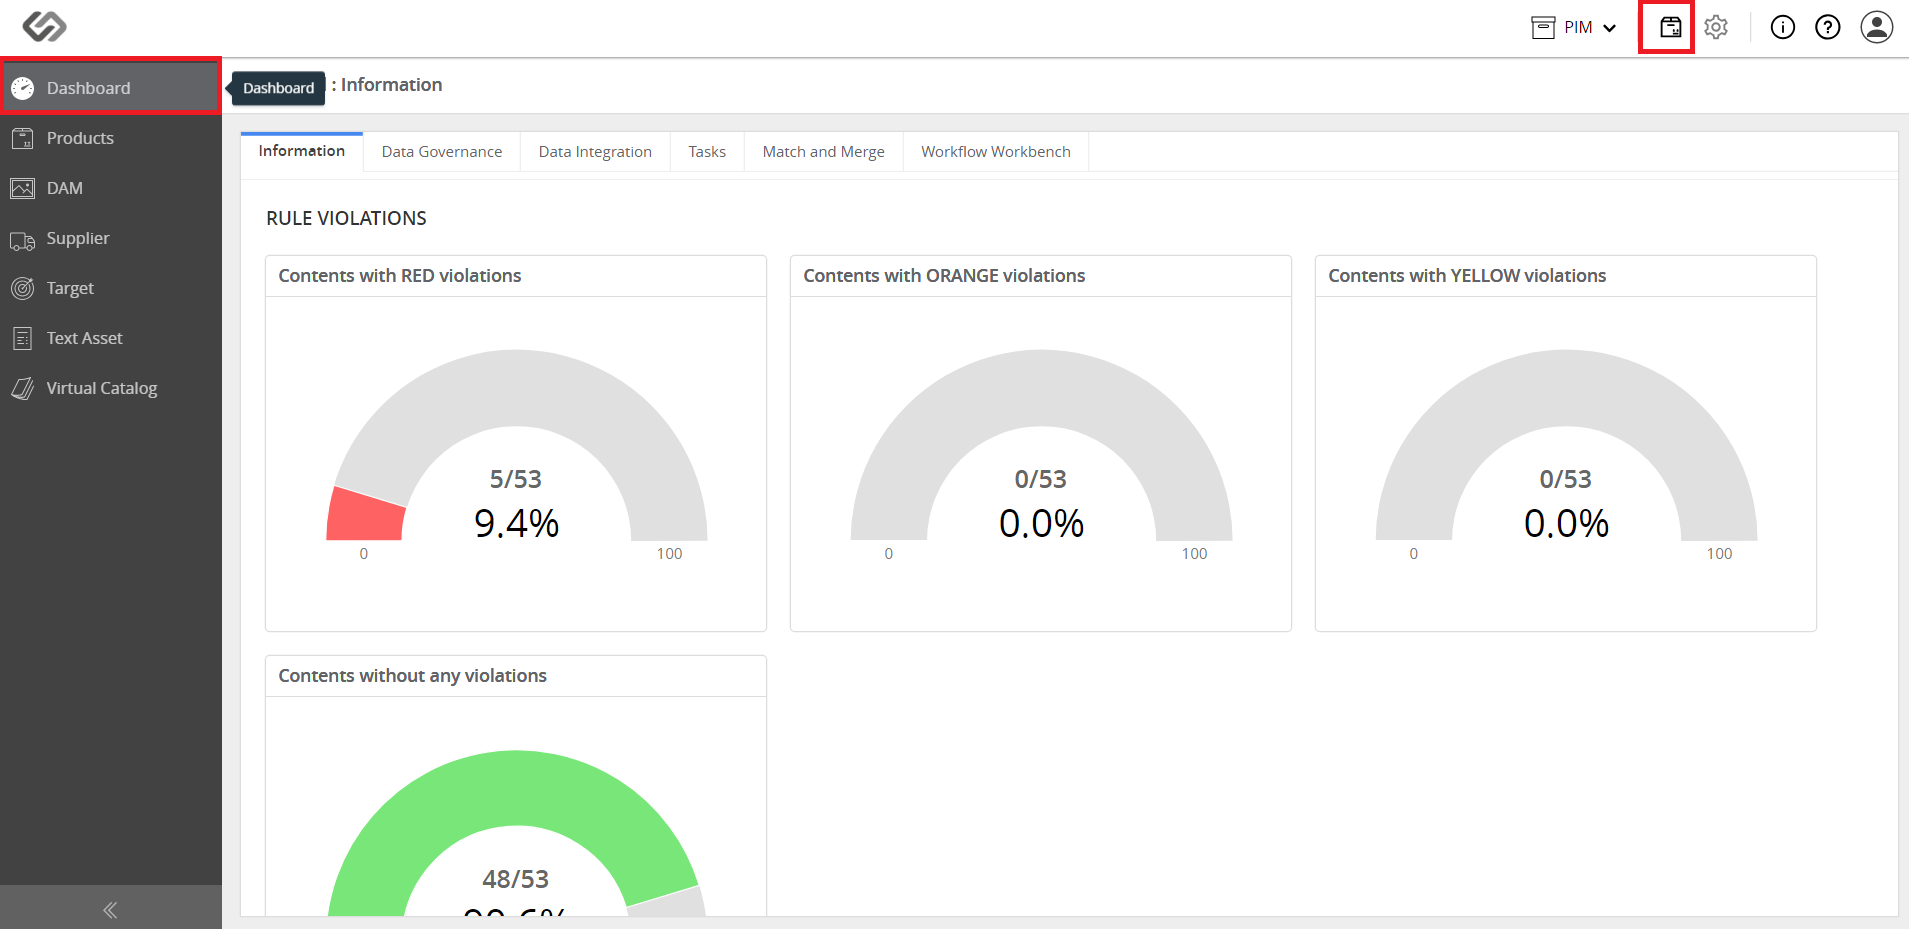
  • Click on the Data Governance tab. A new dashboard for the KPI will be created. Click on Open in Viewer icon to view the details of the KPI using the added taxonomy and tag.
../../../../../_images/pxp_monitordataquality_anewdashboard.PNG

../../../../../_images/pxp_monitordataquality_anewdashboard2.PNG


Contentserv line