Drill Down for KPI Reports

Drill Down for KPI Reports is a data governance feature that sets up drill down criteria for DQ (Data Quality) reports so that responsible users can explore the quality issues.

Key Term:
  • Taxonomy: a taxonomy is a scheme of classification used for an organization’s products.
Description:
  • Different levels can be maintained for the dashboard to dive in the report and get more enhanced review of the report.
  • A user or supplier can have a detailed view of all the products drilled down in the report that allows a user to explore the quality issues.
Related topics:
Application:
  • This feature helps the user or supplier to have an in-depth DQ report for all the products available.

  • A user or supplier can narrow down on the products with quality issues. This can be based on Taxonomy or a Tag.

  • Example:

    A KPI for fashion taxonomy is created, it can be drilled down to a sub-level of the fashion taxonomy, and then again, there can be another drill down based on a Color tag, by which the user can have a detailed report and then explore all the KPI.

How-to: Drill Down for KPI Reports

To do this, follow these steps:


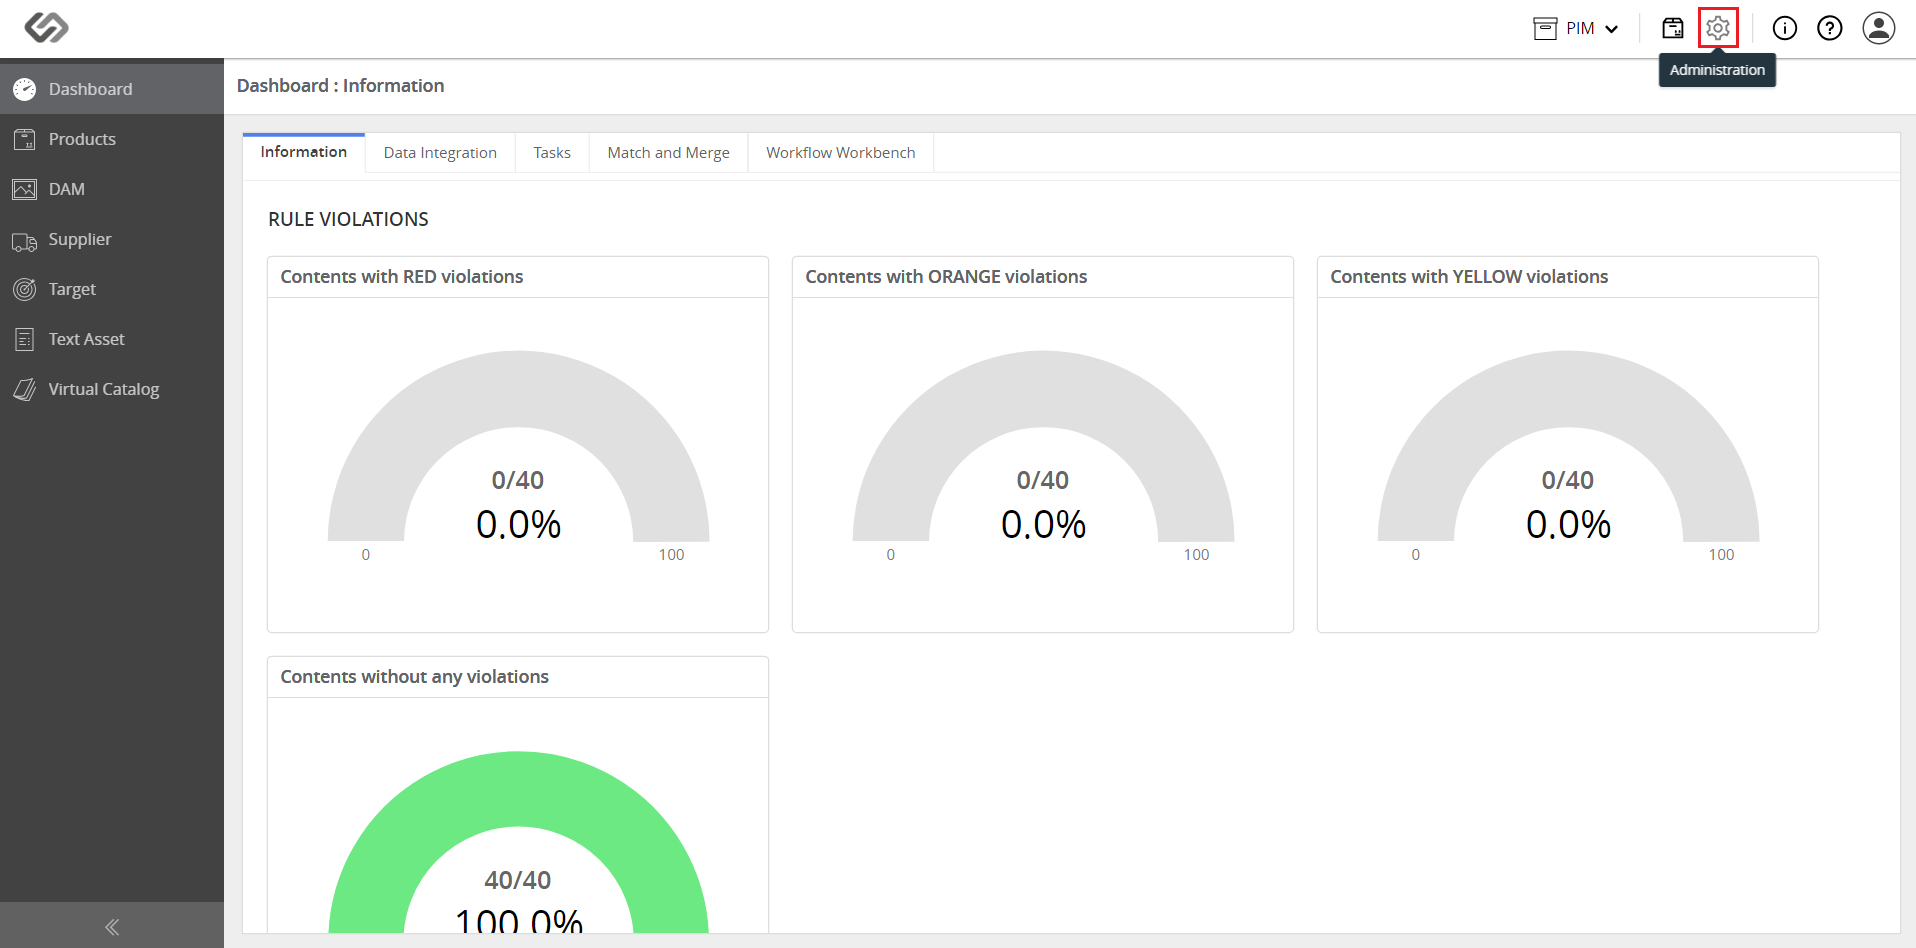
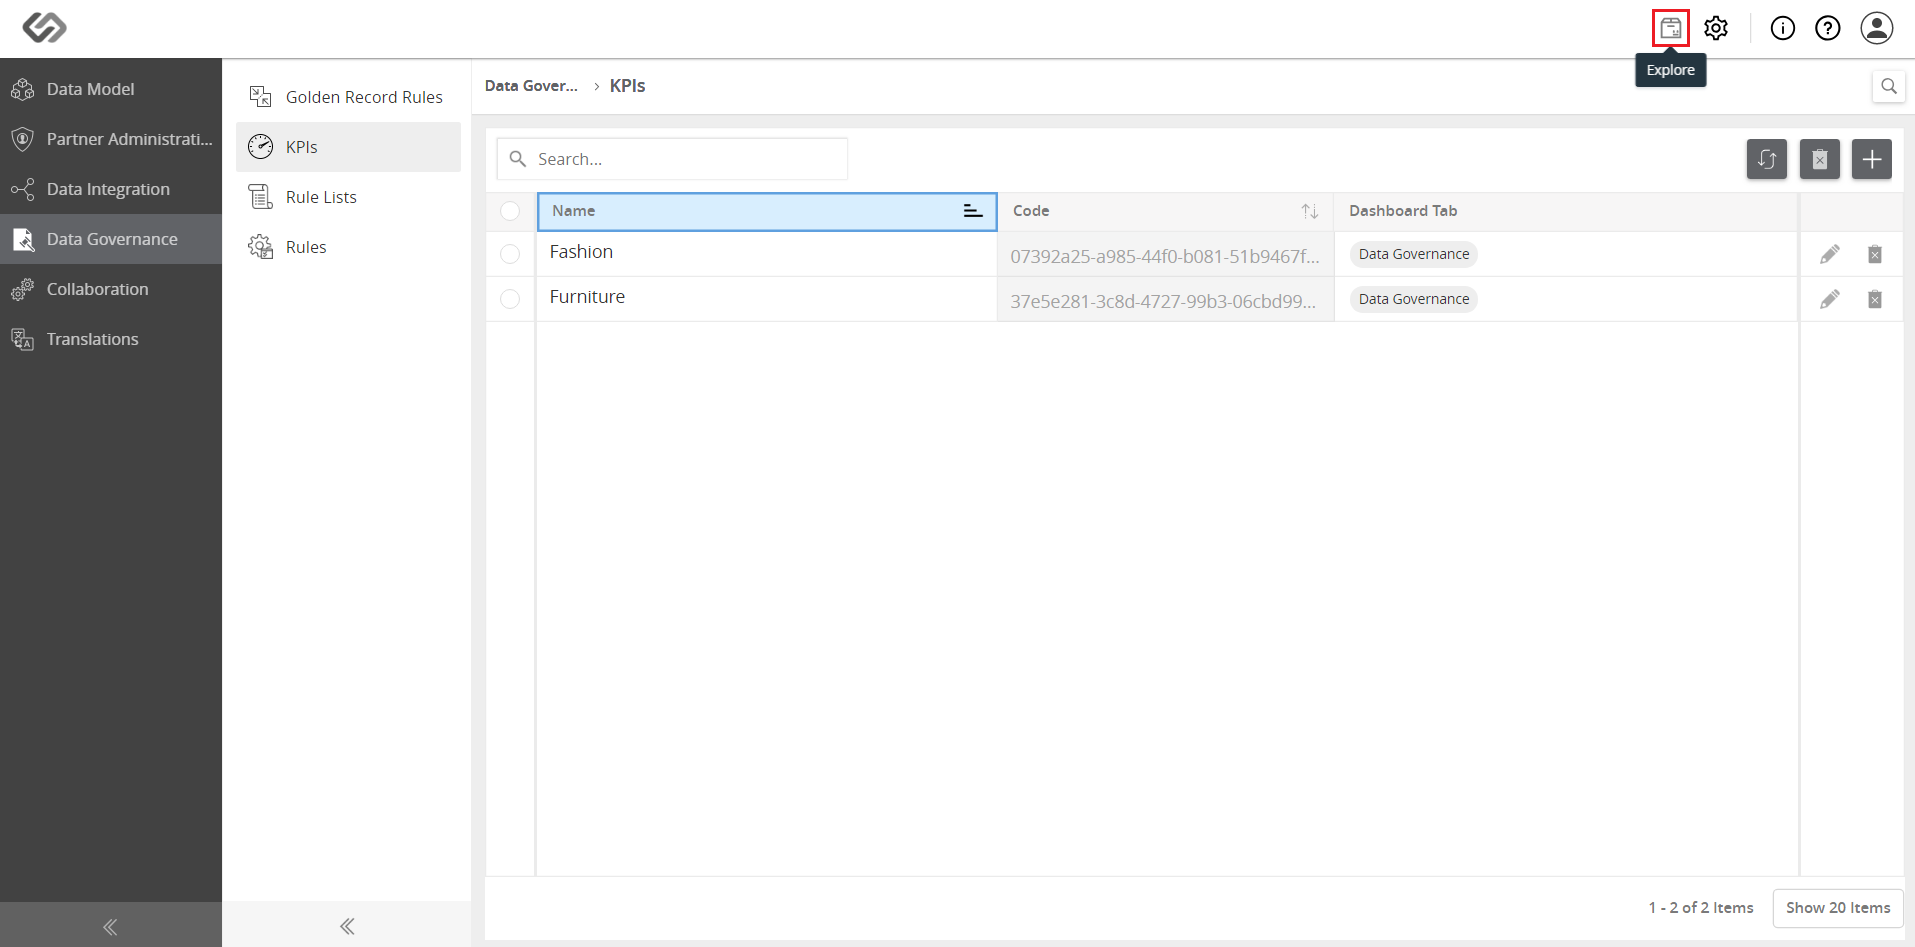
  • Click on the Administration icon.
../../../../../../_images/pxp_drilldownforkpireports_clickadministration.PNG


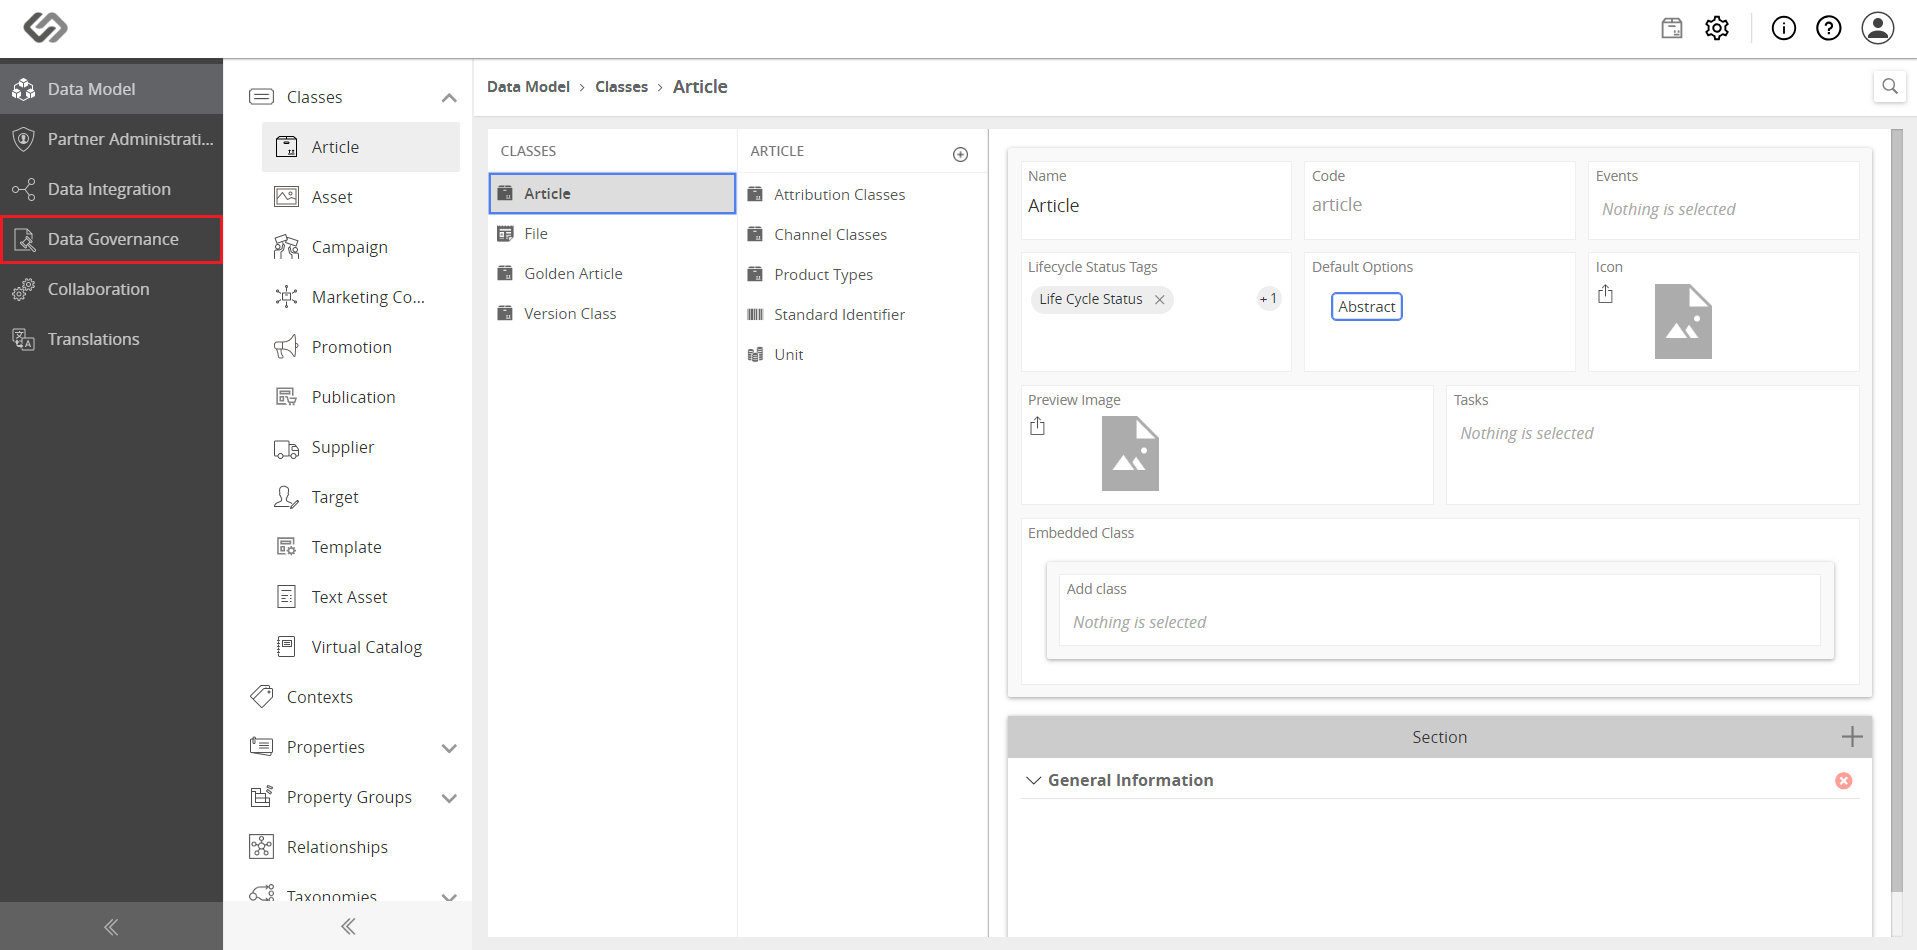
  • Click on Data Governance.
../../../../../../_images/pxp_drilldownforkpireports_clickgovernance.PNG


  • Click on KPIs.
../../../../../../_images/pxp_drilldownforkpireports_clickkpi.PNG


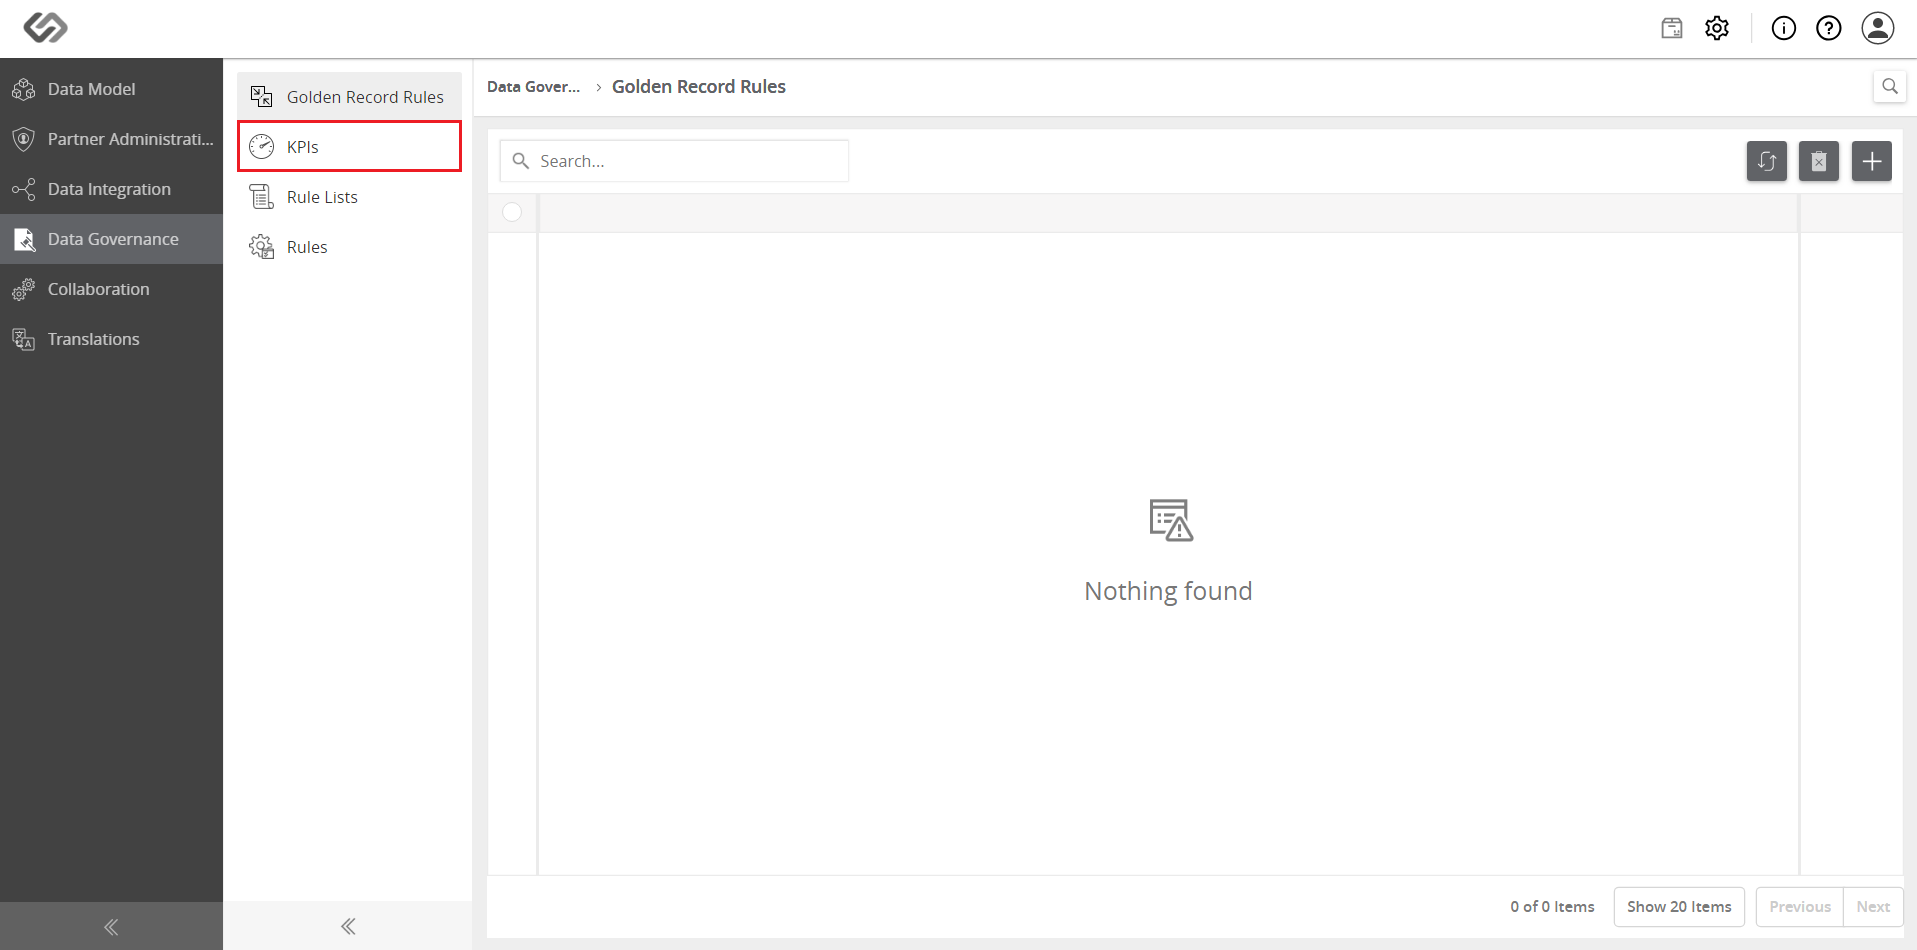
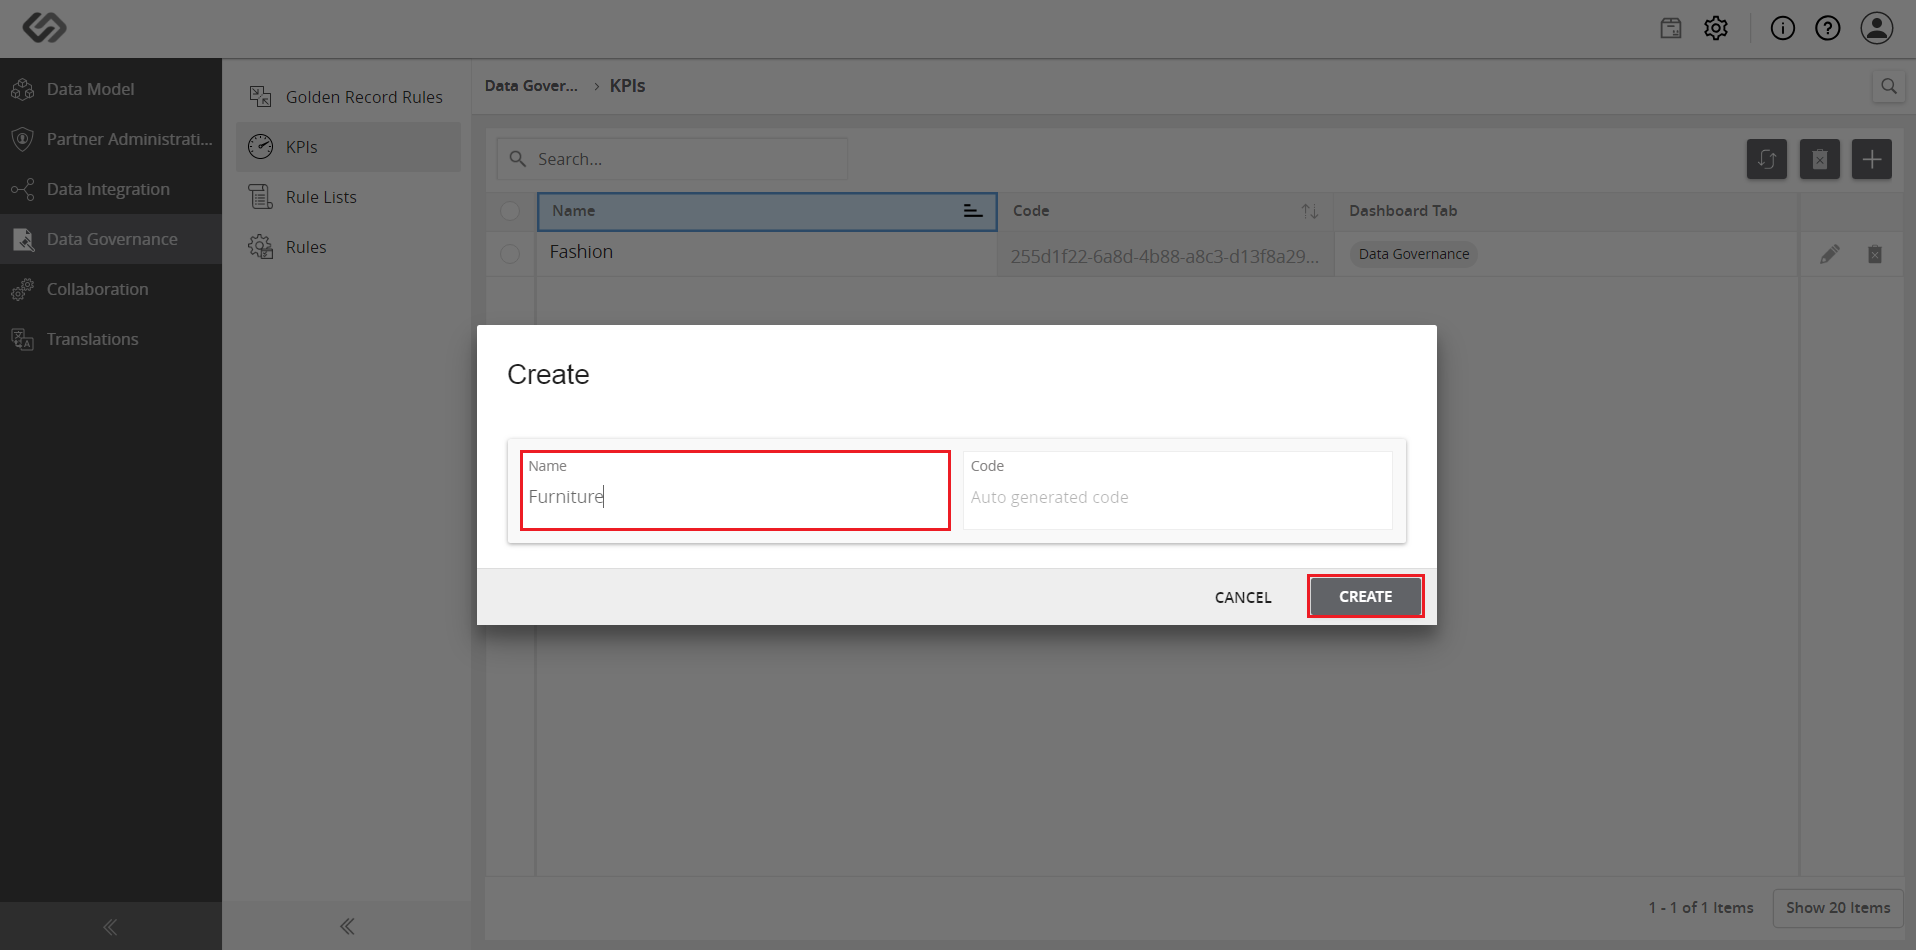
  • Click on the ‘+’ icon to create a new KPI.
../../../../../../_images/pxp_drilldownforkpireports_clickplus.PNG


  • Enter a name for the KPI, then click on the Create button.
../../../../../../_images/pxp_drilldownforkpireports_entername.PNG


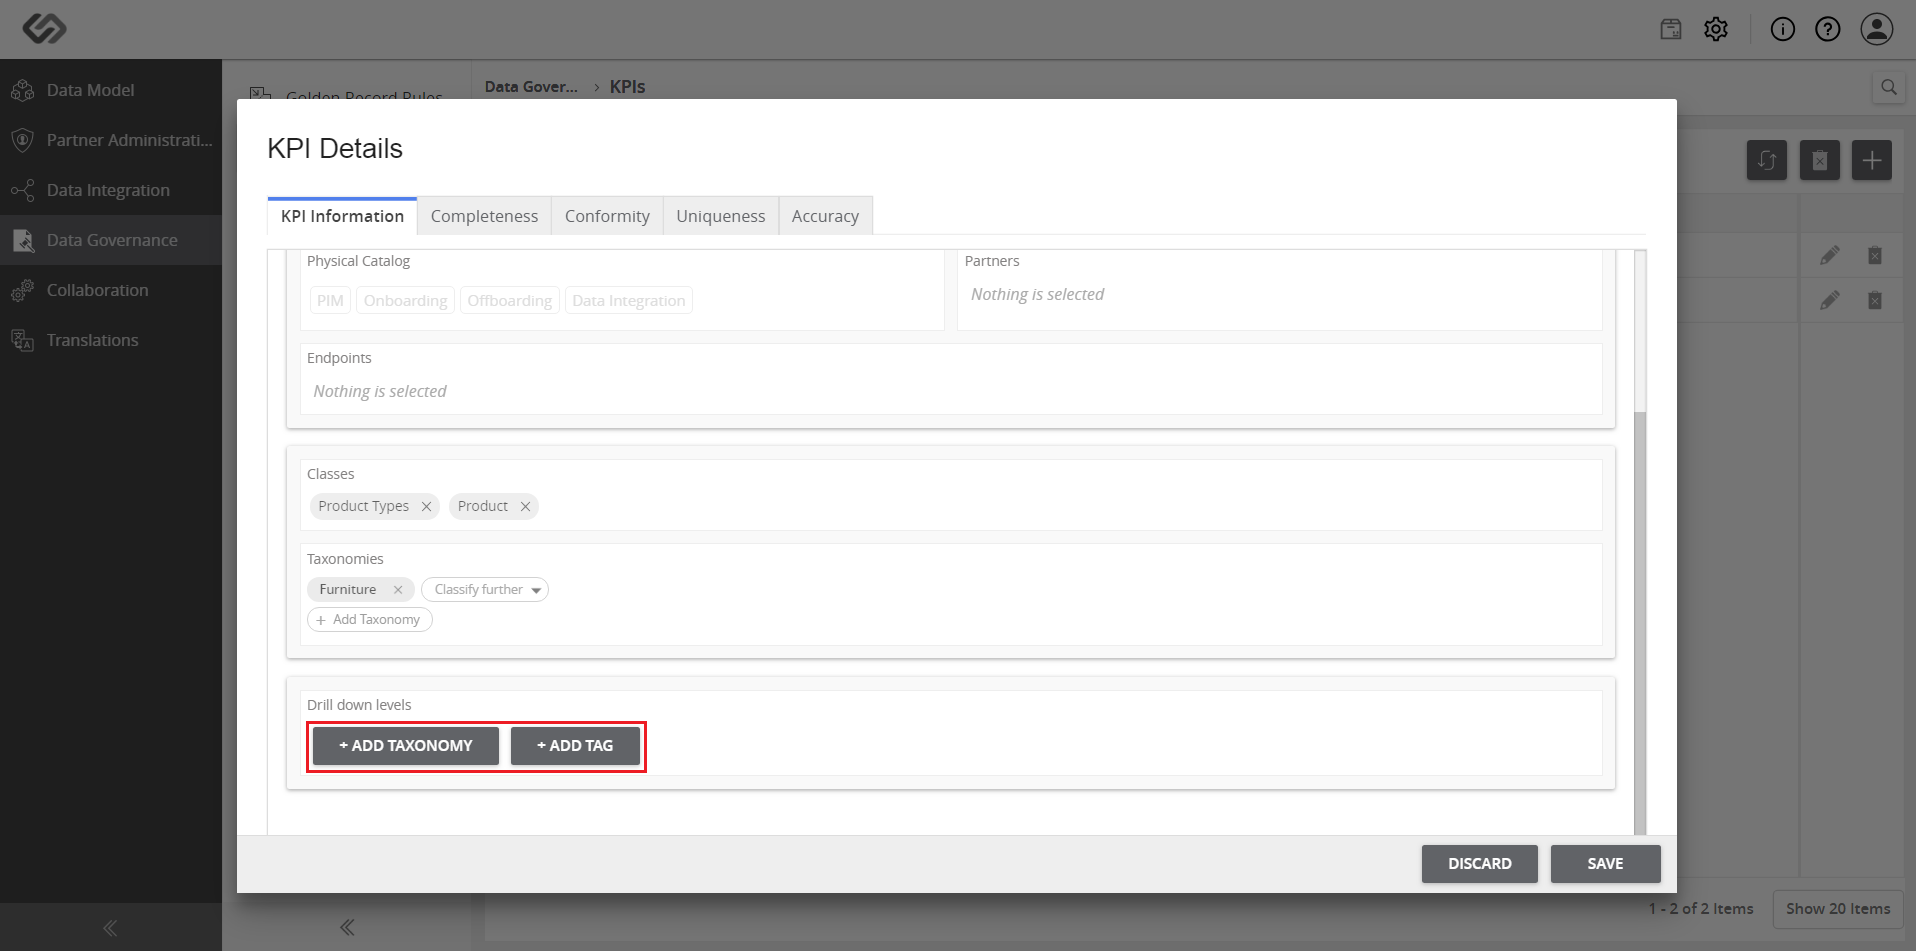
  • On the KPI Information tab, click on Classes and select the class. Click on Taxonomies and select the taxonomy.
../../../../../../_images/pxp_drilldownforkpireports_informationtab.PNG


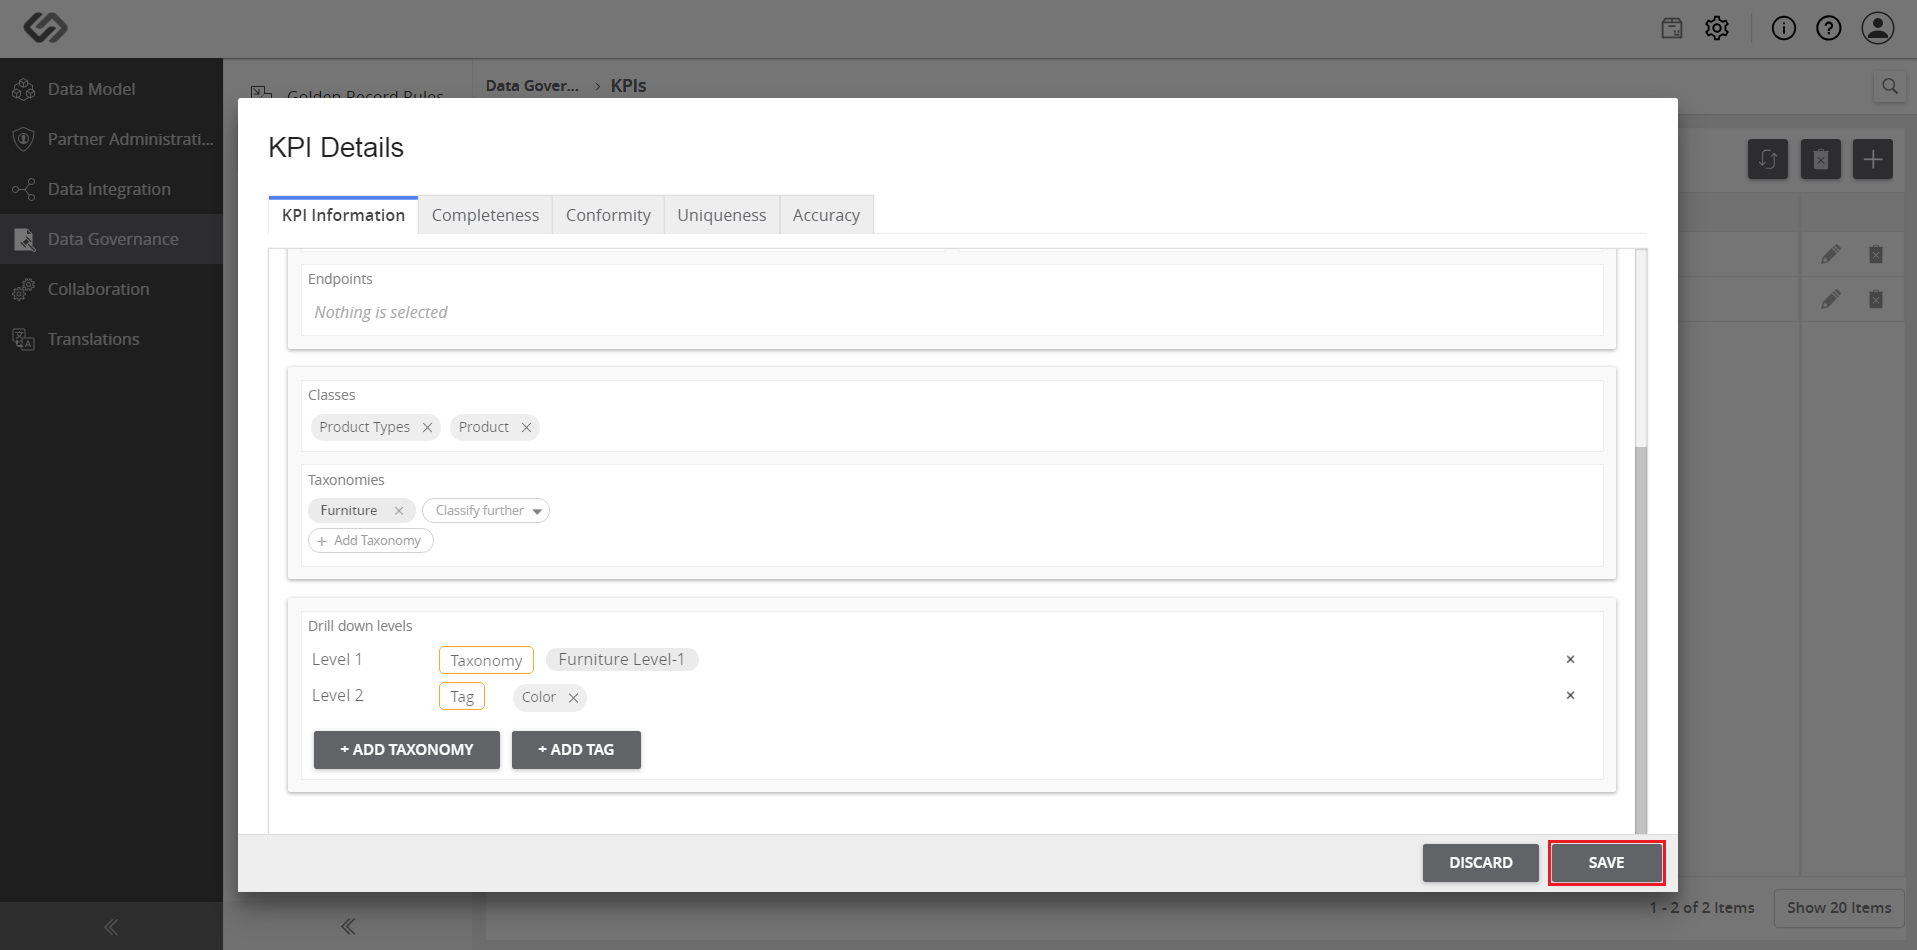
  • Add the tags or taxonomies in the selected KPI drilled down levels.
../../../../../../_images/pxp_drilldownforkpireports_addtagstaxonomy.PNG


  • Click Save to save the changes.
../../../../../../_images/pxp_drilldownforkpireports_clicksave.PNG


  • Click on the OK button, then click on the Explore icon to go back to the dashboard.
../../../../../../_images/pxp_drilldownforkpireports_clickexplore.PNG

../../../../../../_images/pxp_drilldownforkpireports_clickexplore2.PNG


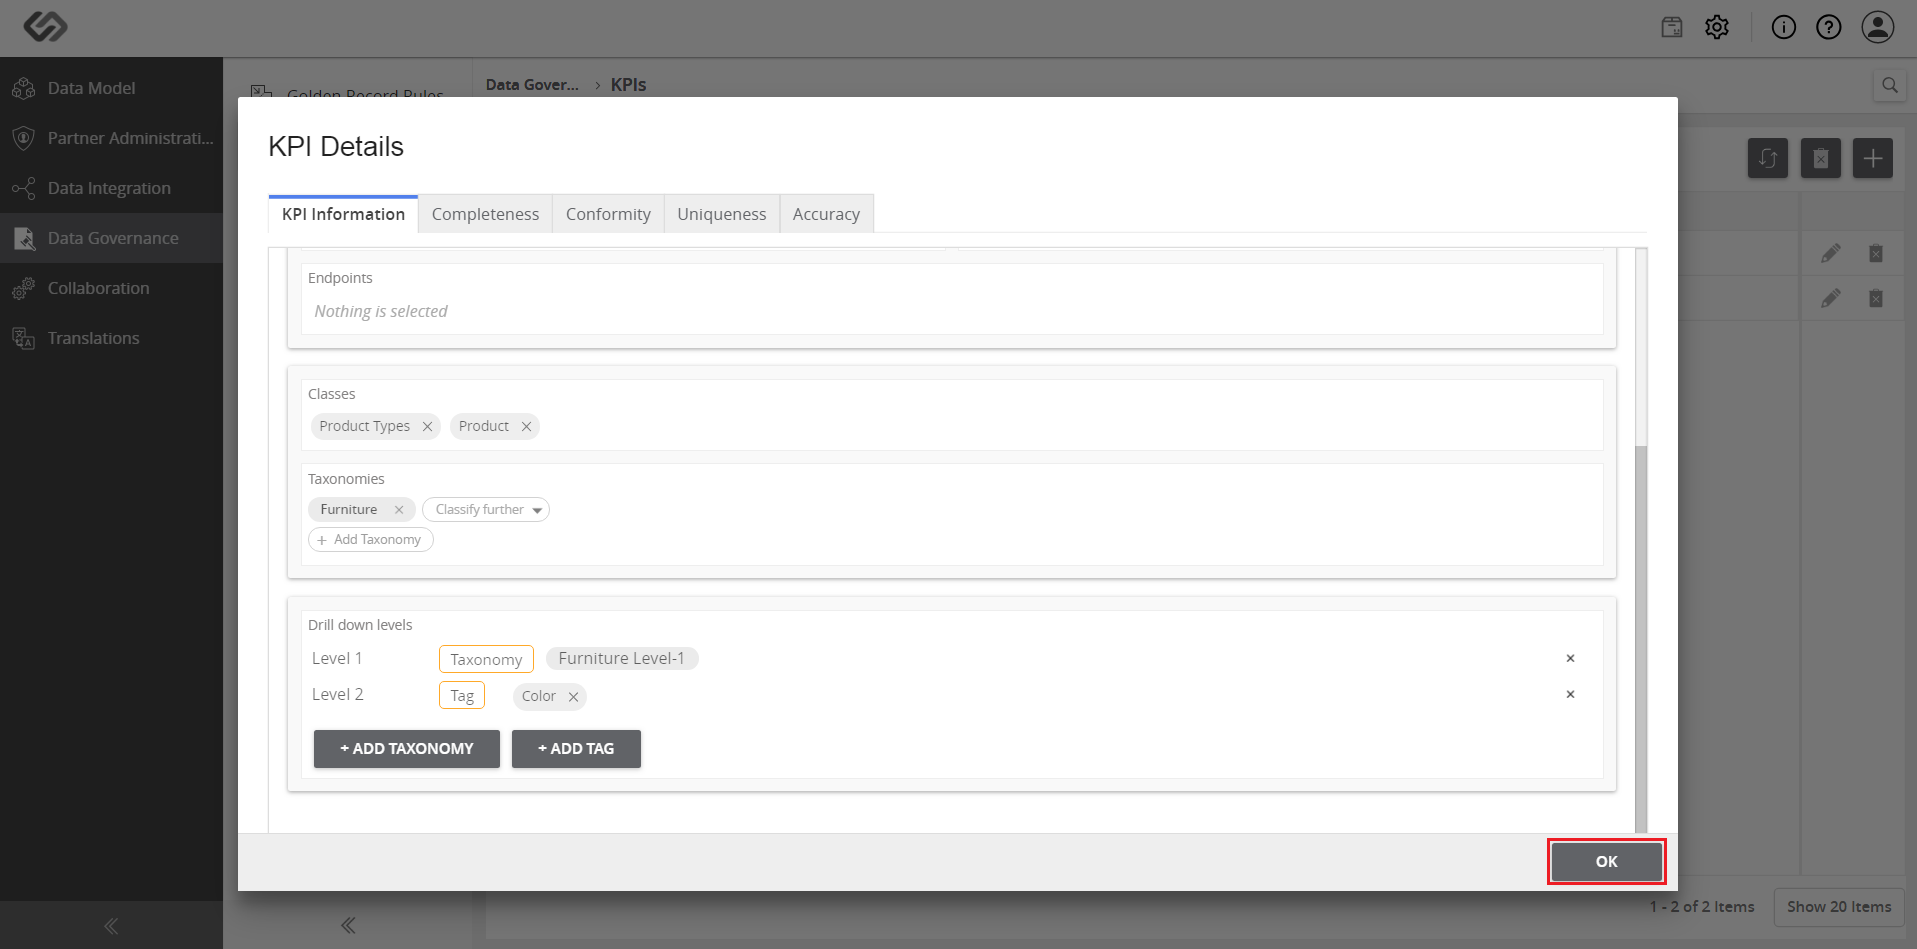
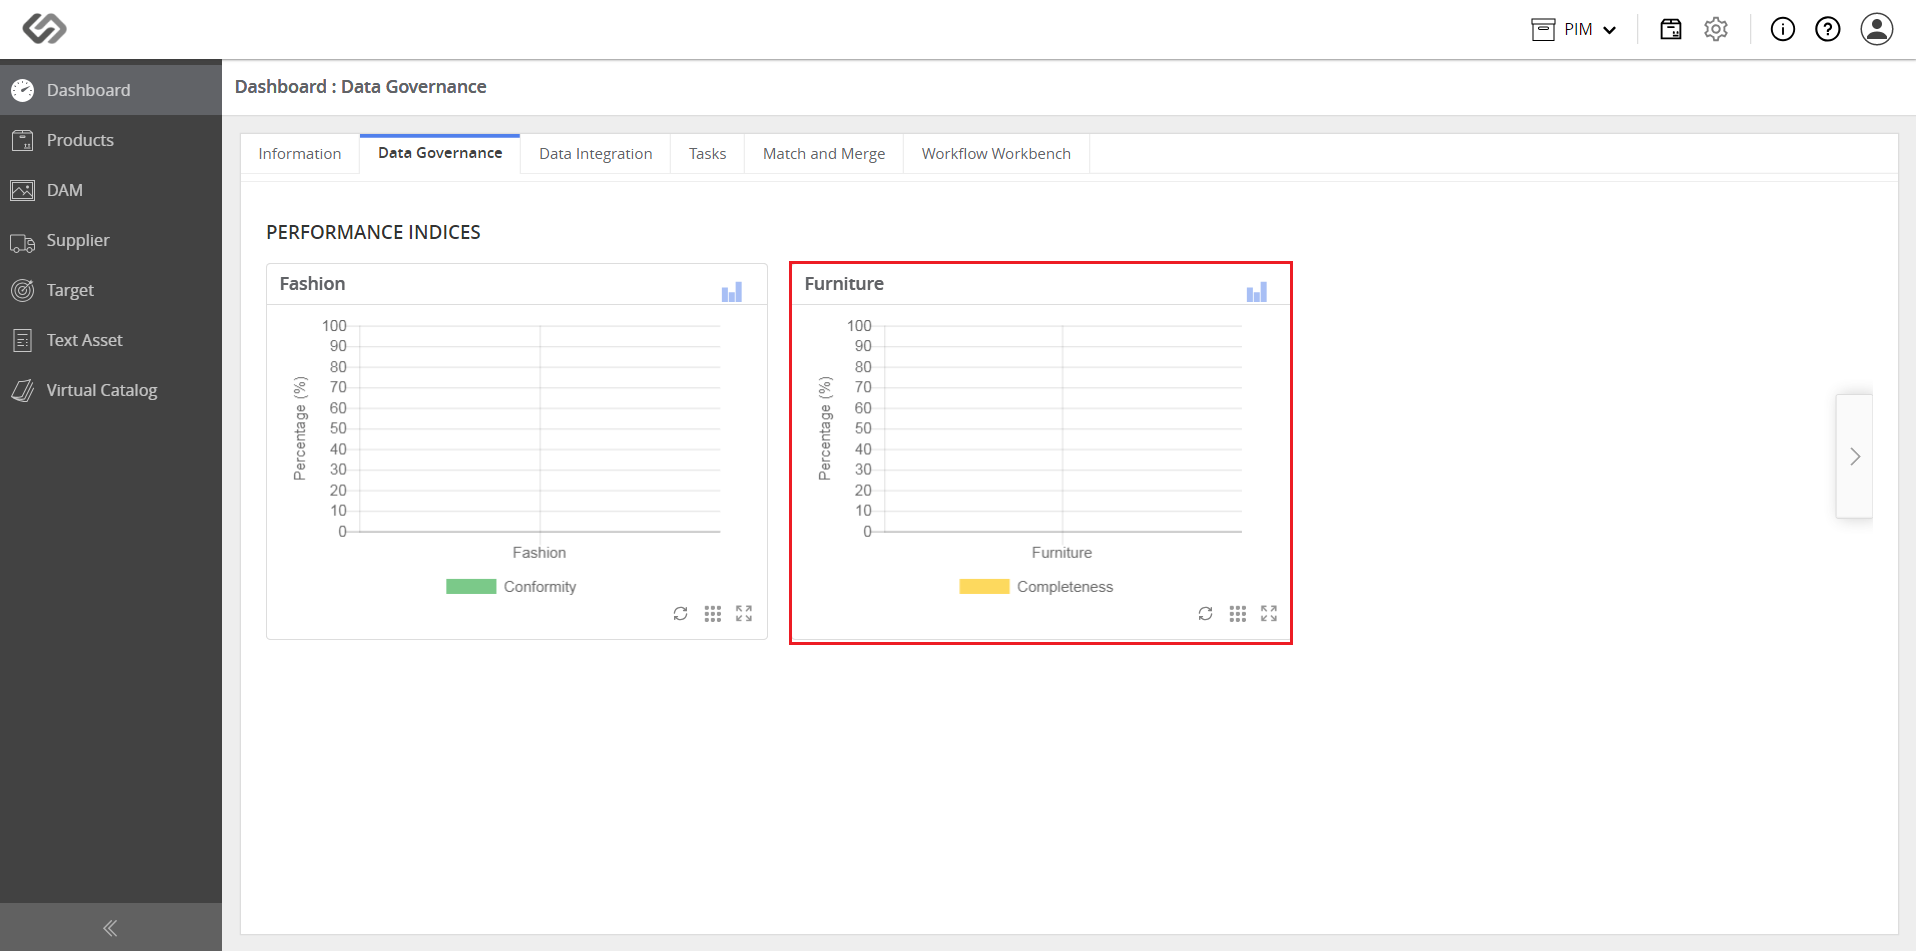
  • Click on the Data Governance tab. Click on the graph and the KPI is drilled down with the appropriate taxonomy and tag.
../../../../../../_images/pxp_drilldownforkpireports_clickdatagovernance.PNG

../../../../../../_images/pxp_drilldownforkpireports_clickdatagovernance2.PNG


Contentserv line